Retrospective reporting
Back after a long pause. Panel surveys traditionally interview respondents at regular intervals, for example monthly or yearly. This interval is mostly chosen for practical reasons: interviewing people more frequently would lead to a large respondent burden, and a burden on data processing and dissemination. For these practical reasons, panel surveys often space their interviews one year apart. Many of the changes (e.g. changes in household composition) we as researchers are interested in occur slowly, and annual interviews suffice to capture these changes.
Sometimes we want to get reports at a more detailed level, however. For example, we would like to know how often a respondents visits a doctor (general practitioner) in one year, or when a respondent went on holidays. In order to get at such an estimate, survey researchers can do one of several things:
1. we can ask a respondent to remember all doctor visits in the past year, and rely on retrospective recall. We know that doesn’t work very well, because respondents cannot remember all visits. Instead, respondents will rely on rounding, guessing and estimation to come to an estimate.
2. we can ask respondents for visits in say the past month, and rely on extrapolation to get to an annual estimate. This strategy works well if doctor visits are stable throughout the year (which they are not).
3. We can try to break down the year into months, and instead of asking for doctor visits in the last year, ask for doctor visits in each month, reducing the reference period. We can stimulate the retrieval of the correct information further by using a timeline or by the use of landmarks.
4. We can interview respondents more often. So, we conduct 12 monthly interviews instead of one annual interview, thereby reducing both the reference and recall period.
With Tina Glasner and Anja Boeve , I recently published a paper that compared methods 1, 3 and 4 within the same study to estimate the total number of doctor (family physician) visits. This study is unique in the sense that we used all three methods within the same respondents, so for each respondents we can see how reporting is different when we rely on annual recall, monthly recall, and on whether we use an annual or monthly reference period. Our study also included an experiment to see whether timelines and landmarks improved recall.
You can find the full paper here .
We find that respondents give different answers about their doctor visits depending on how we ask them. The estimates for annual visits are;
- annual estimate (1 question): 1.96 visits
- monthly estimate with 12-month recall: 2.62 visits
- monthly estimate with 1-month recall: 3.90 visits
The average number of doctor visits in population registers is 4.66, so the monthly estimate with 1 month-recall periods comes closest to our population estimate.
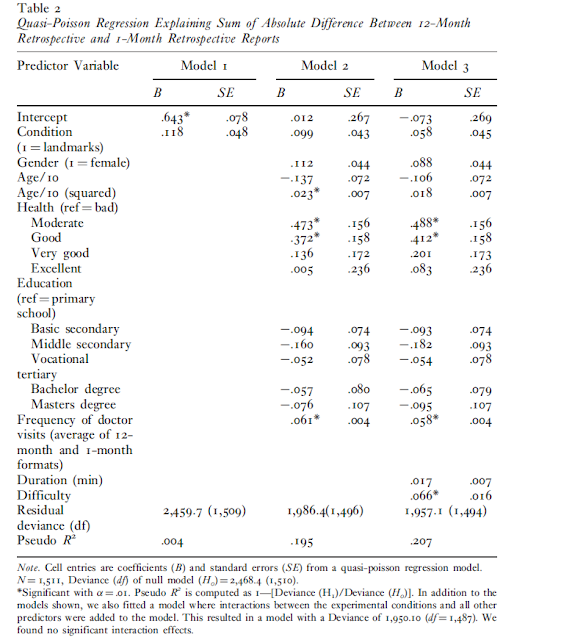
As a final step, we were interested in understanding which respondents give different answers depending on the question format. For this, we studied the within-person absolute difference between the monthly estimates with a 12-month and 1-month recall period. The table below shows that the more frequent doctor visits are, the larger the differences between the 1 month and 12-month recall periods. This implies that respondents with more visits tend to underreport them more often when the recall period is long. The same holds for people in moderate and good health. People in bad health often go to the doctor regularly, and remember these visits. More infrequent visits are more easily forgotten. Finally, we find that the results of our experiment are non-significant. Offering respondents personal landmarks, and putting these next to the timeline to improve recall, does not lead to smaller differences.
In practice, these findings may be useful when one is interested in estimating frequencies of behavior over an annual period. Breaking up the ‘annual-estimate’ question into twelve monthly questions helps to improve data quality. Asking about such frequencies at 12 separate occasions further helps, but this is unlikely to be feasible due to the large increased costs of more frequent data collection. In self-administered web-surveys this might however be feasible. Splitting up questionnaires into multiple shorter ones may not only reduce burden, but can increase data quality for specific survey questions as well.
