Switching from face-to-face to self-interviewing. The problem of mode effects
One of the major problems in estimating the mode measurement effect in (mixed-mode) surveys is that isolation of the causal effect of mode on measurement is difficult. Using face-to-face will result in different types of respondents that participate in the survey than when recruitment is done using postal invitations. Differences in selection effects that are hard to separate from the fact that respondents also react differently to the mode of the interview. Re-interviewing the same respondents in different modes works nicely, but that design is a bit artificial, because you have to repeat an entire interview in different modes.
In 2024, I wrote a report for the European Social Survey investigating mode effects in the transition the ESS is making toward self-completion. The project page, which also includes other interesting reports on e.g. how to approach respondents, do within-household selections can be found here .
The ESS has traditionally been completed using face-to-face recruitment of respondents and interviewing. In round 10, nine countries however decided to switch to a push-to-web approach in which respondents are typically invited using postal mail. They are first asked to complete the ESS online, while paper completion is available for respondents requesting this, and for nonresponse follow-ups. Here, I combine all web and paper responses and call them ‘self-interviewing’. The reason nine countries made the switch was that partly due to the ESS making a general transition to web, but also because of the fact that Covid-19 made it harder to do interviews using face-to-face interviewing.
This quasi-experimental design however yields a nice opportunity to compare what happens when data collection switches to self-completion. Nine countries made this switch in round 10, while 22 countries used face-to-face interviewing in both rounds 9 and 10. I will for now concentrate on comparing aggregate changes in both groups. There are several reasons why we may see such changes: there may be real change, differences in selection effects across time, or measurement differences. So comparing aggregate change over time does not give us an answer into what causes mode effects (more on this another time perhaps: the ESS also has experimental data). But it does show what happens when the ESS is used to do analyses over time in the situation where at some point there is a mode change. The ESS is used quite a bit for these kinds of analyses .
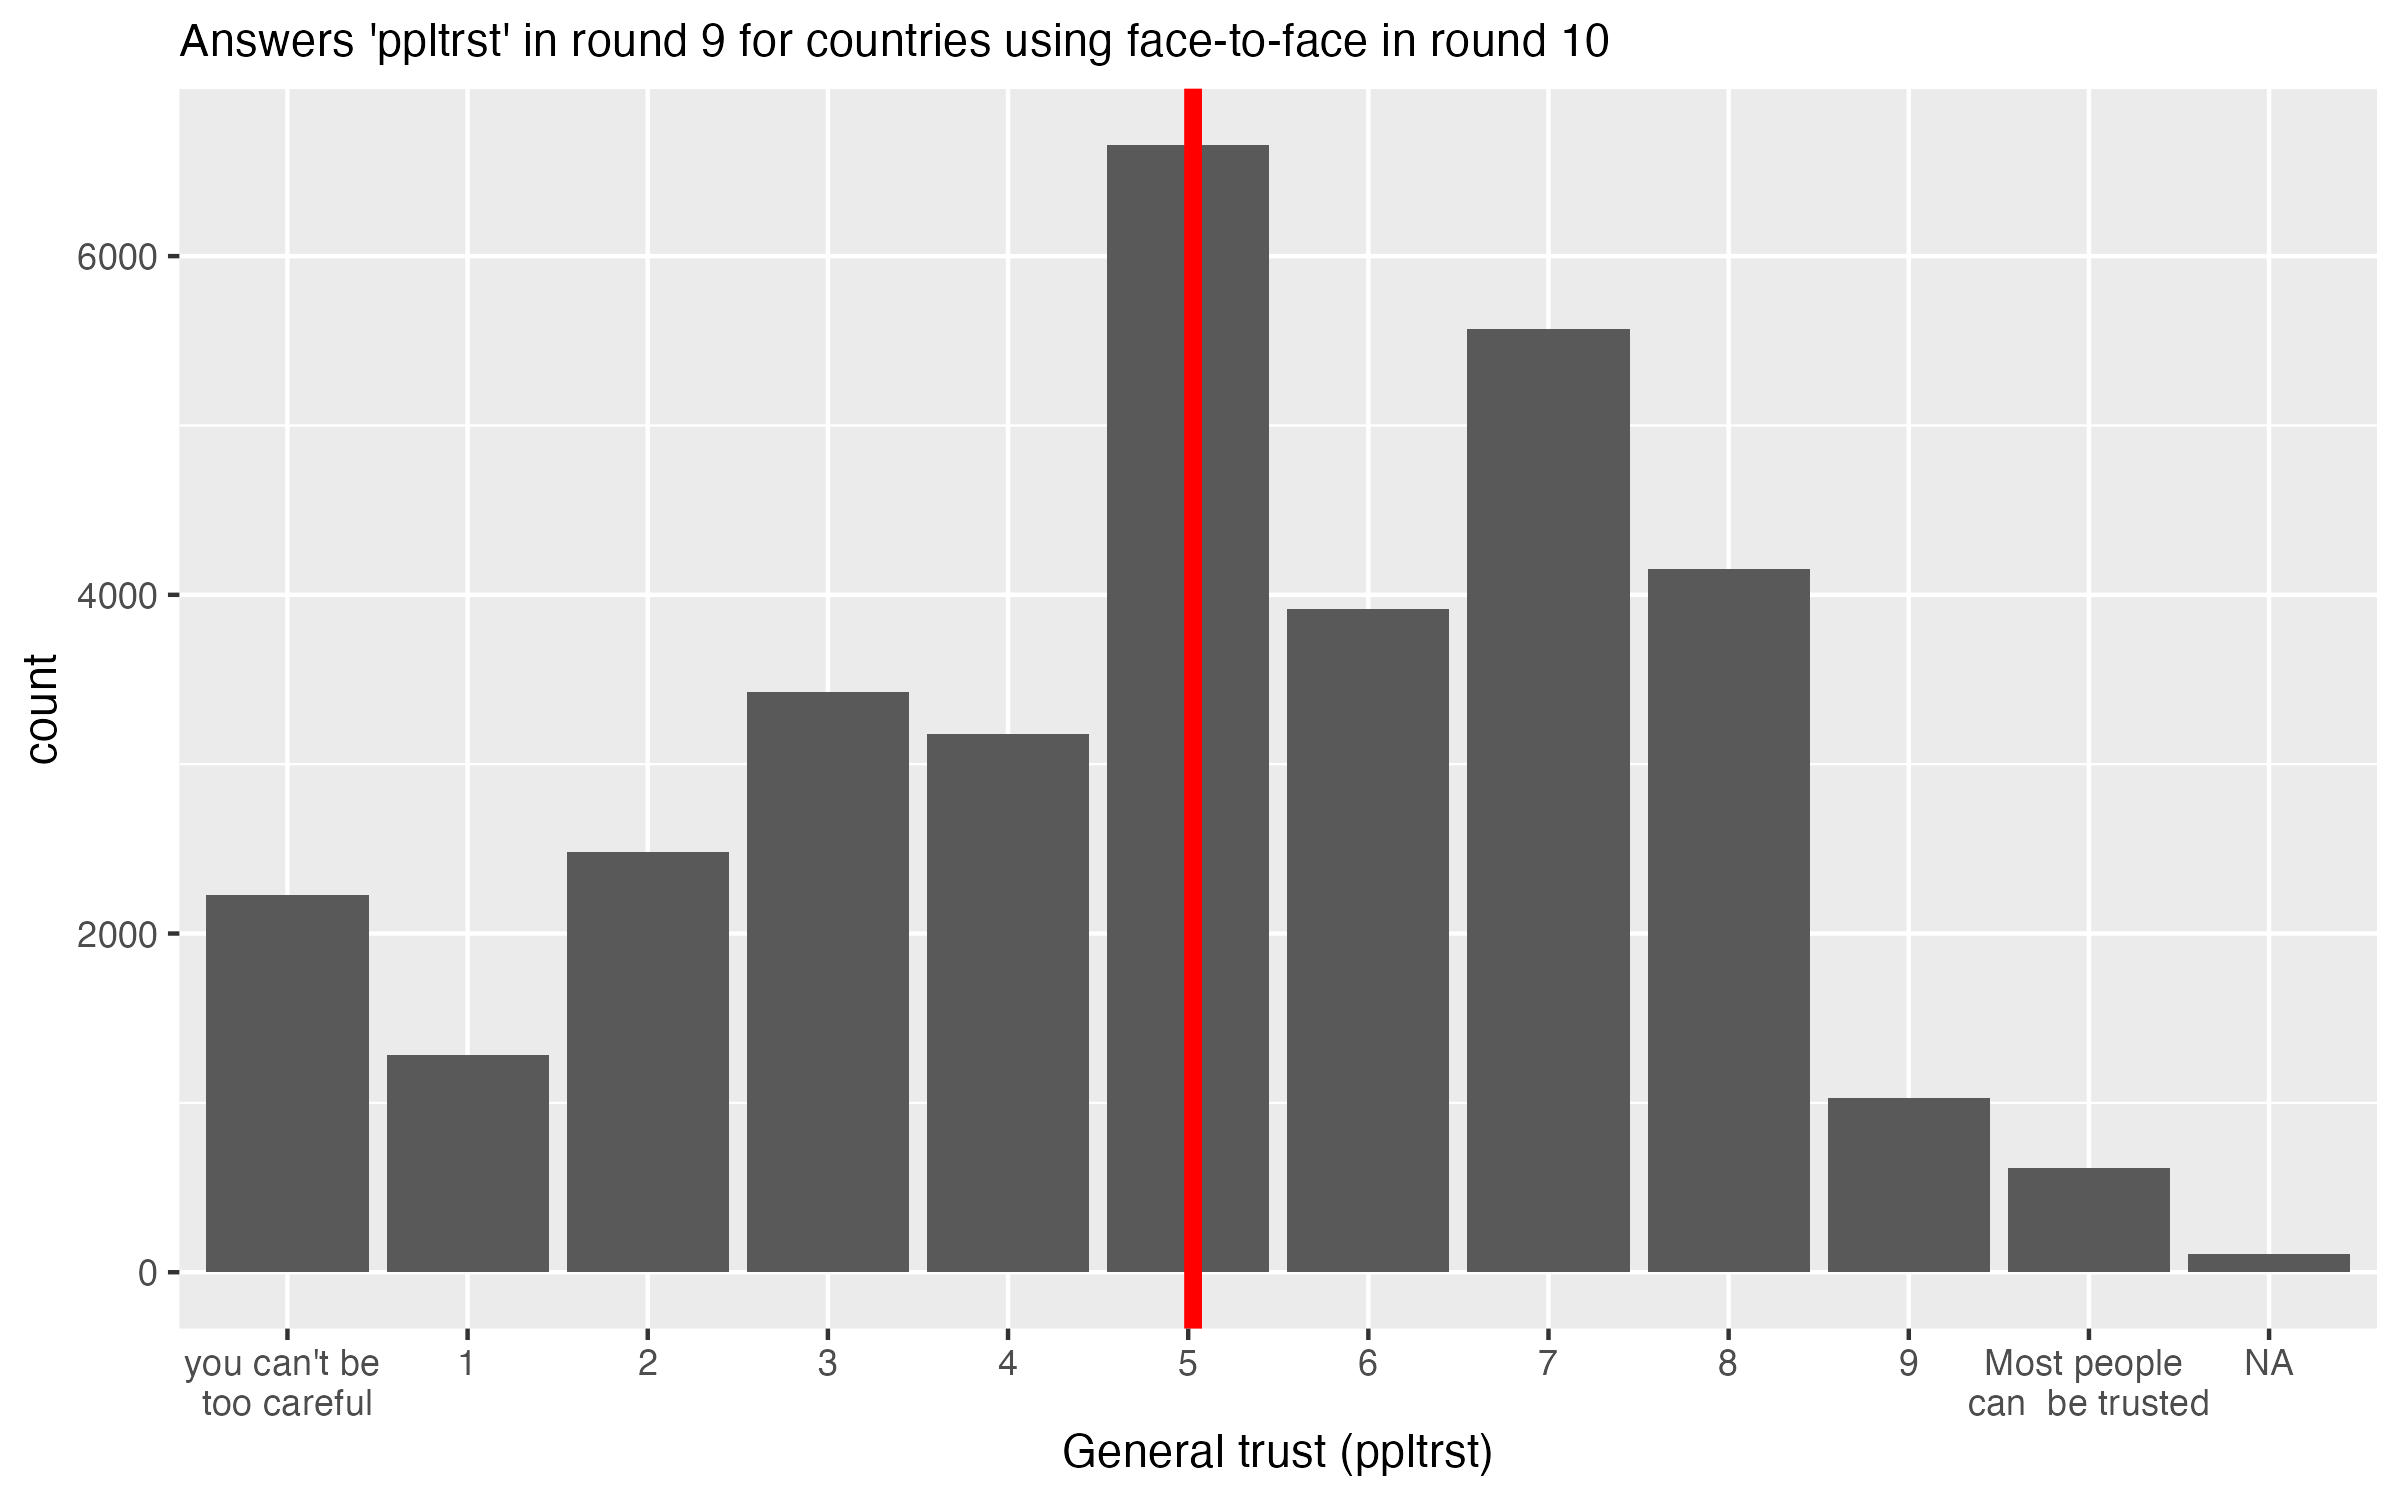
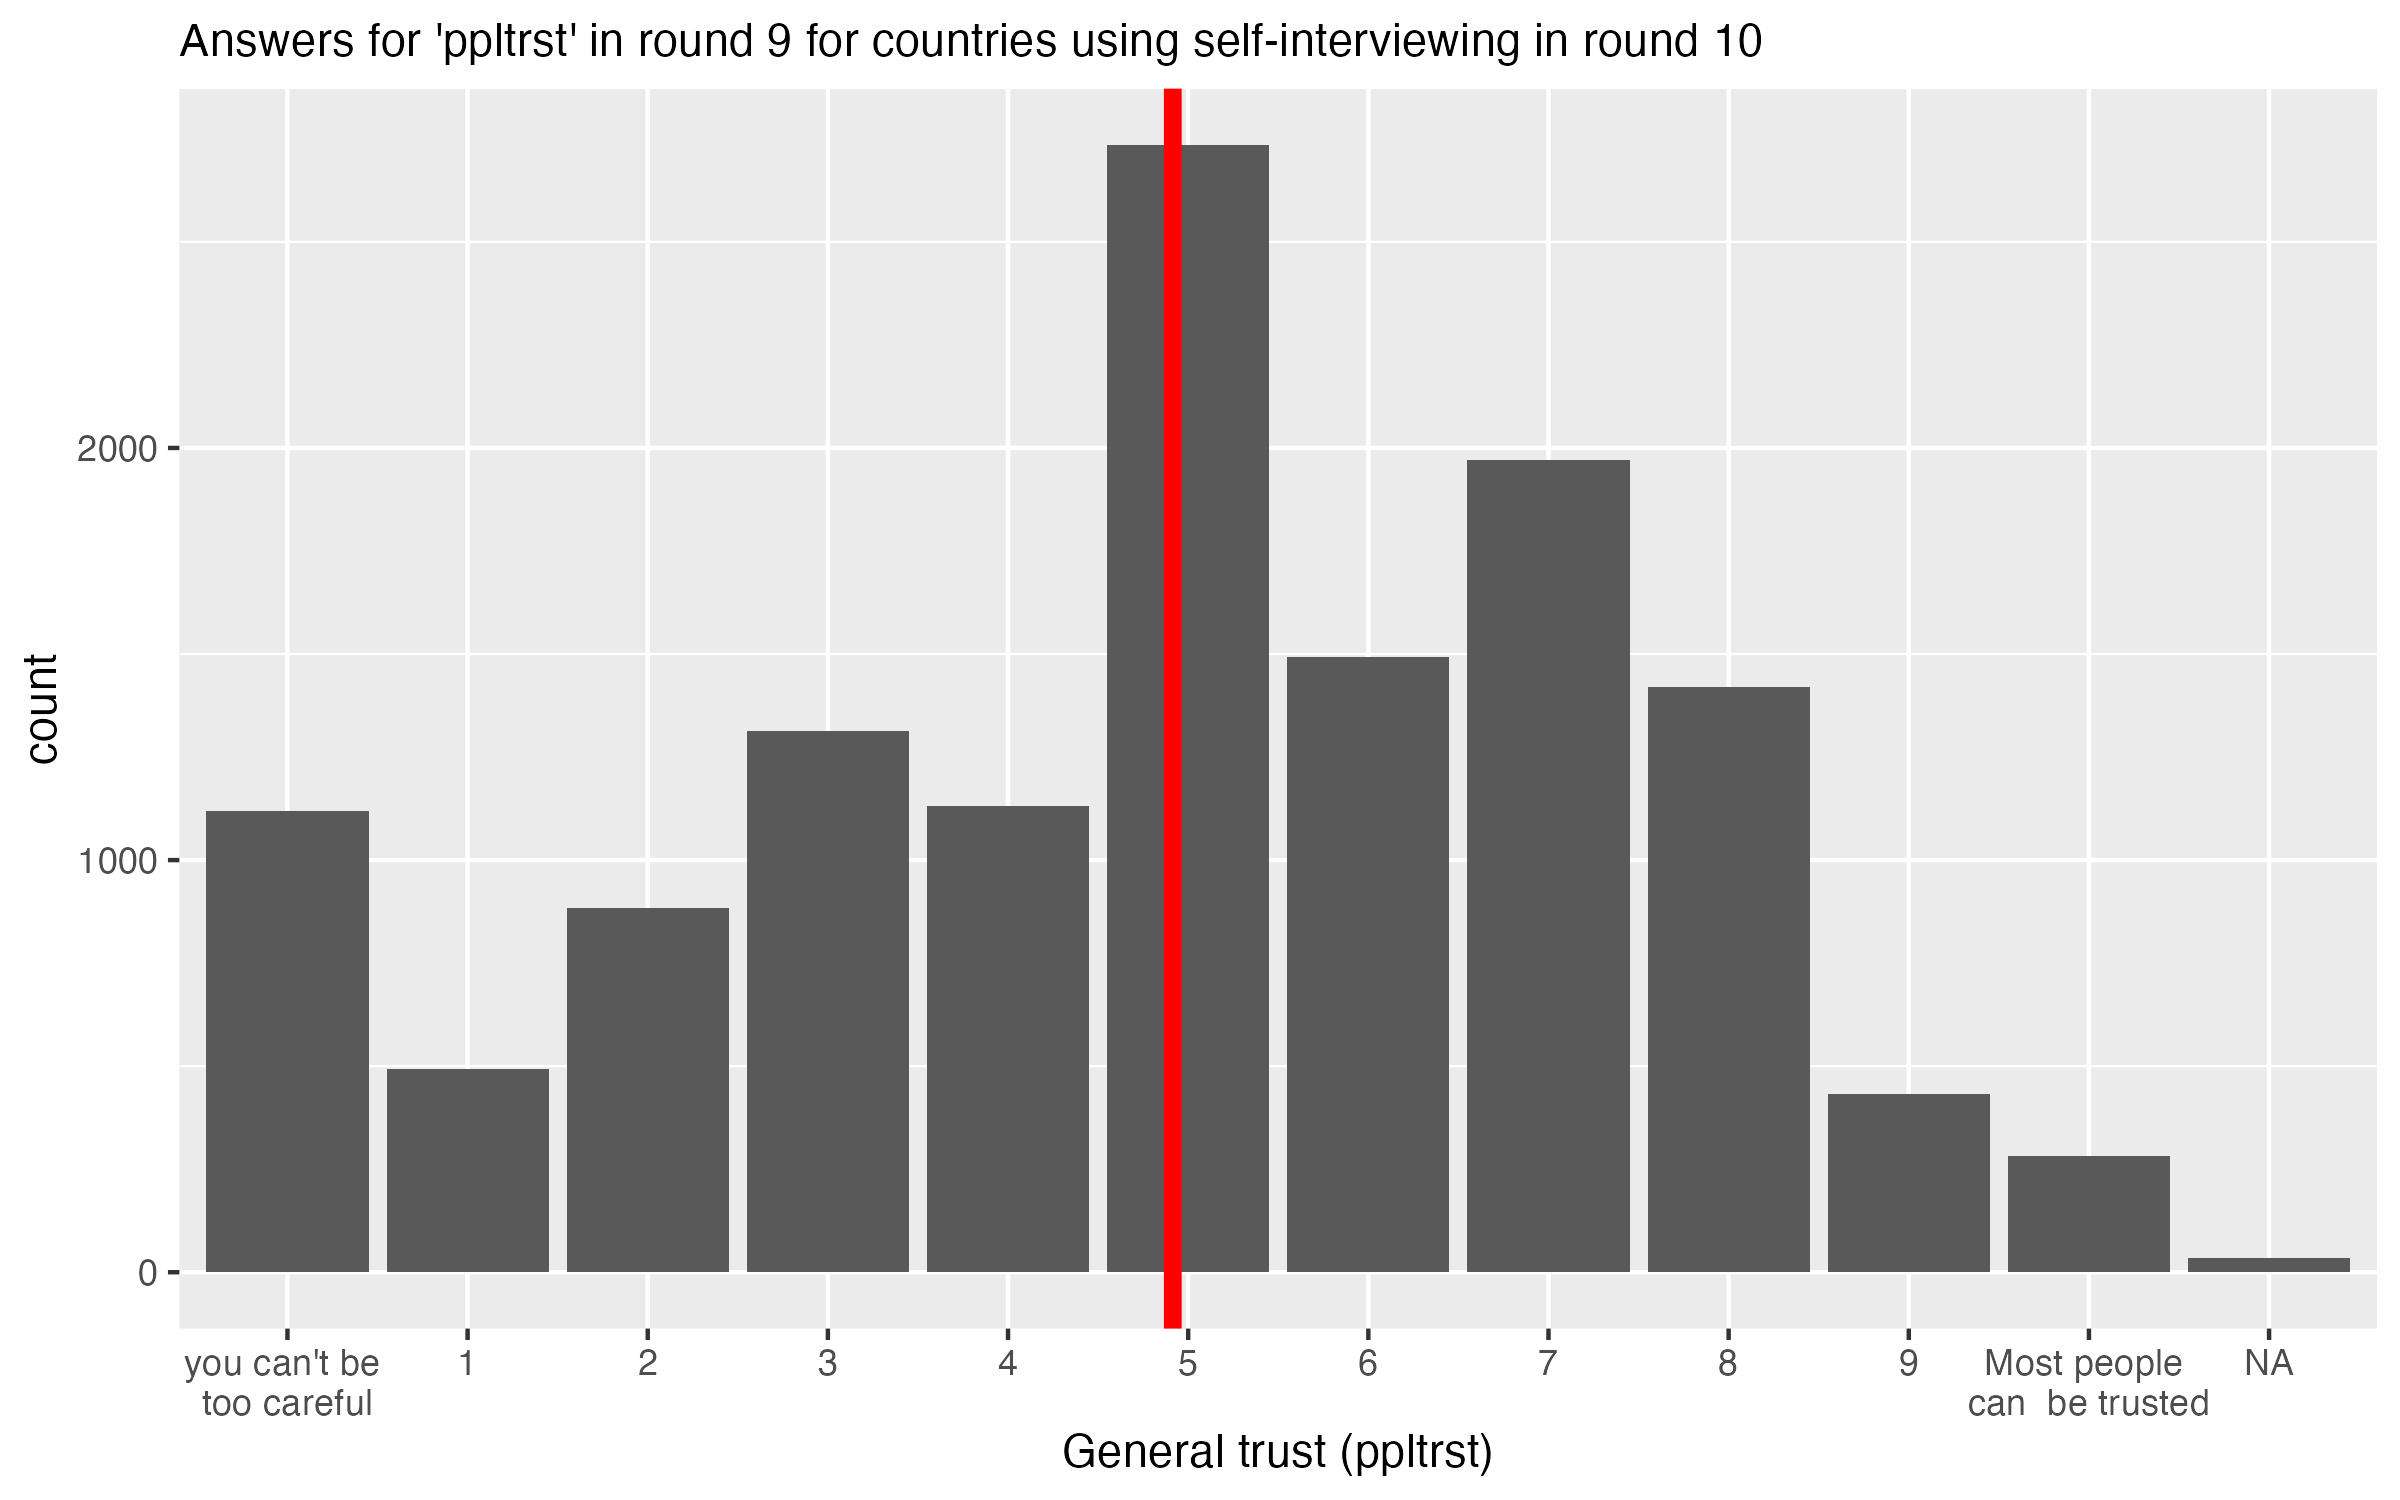
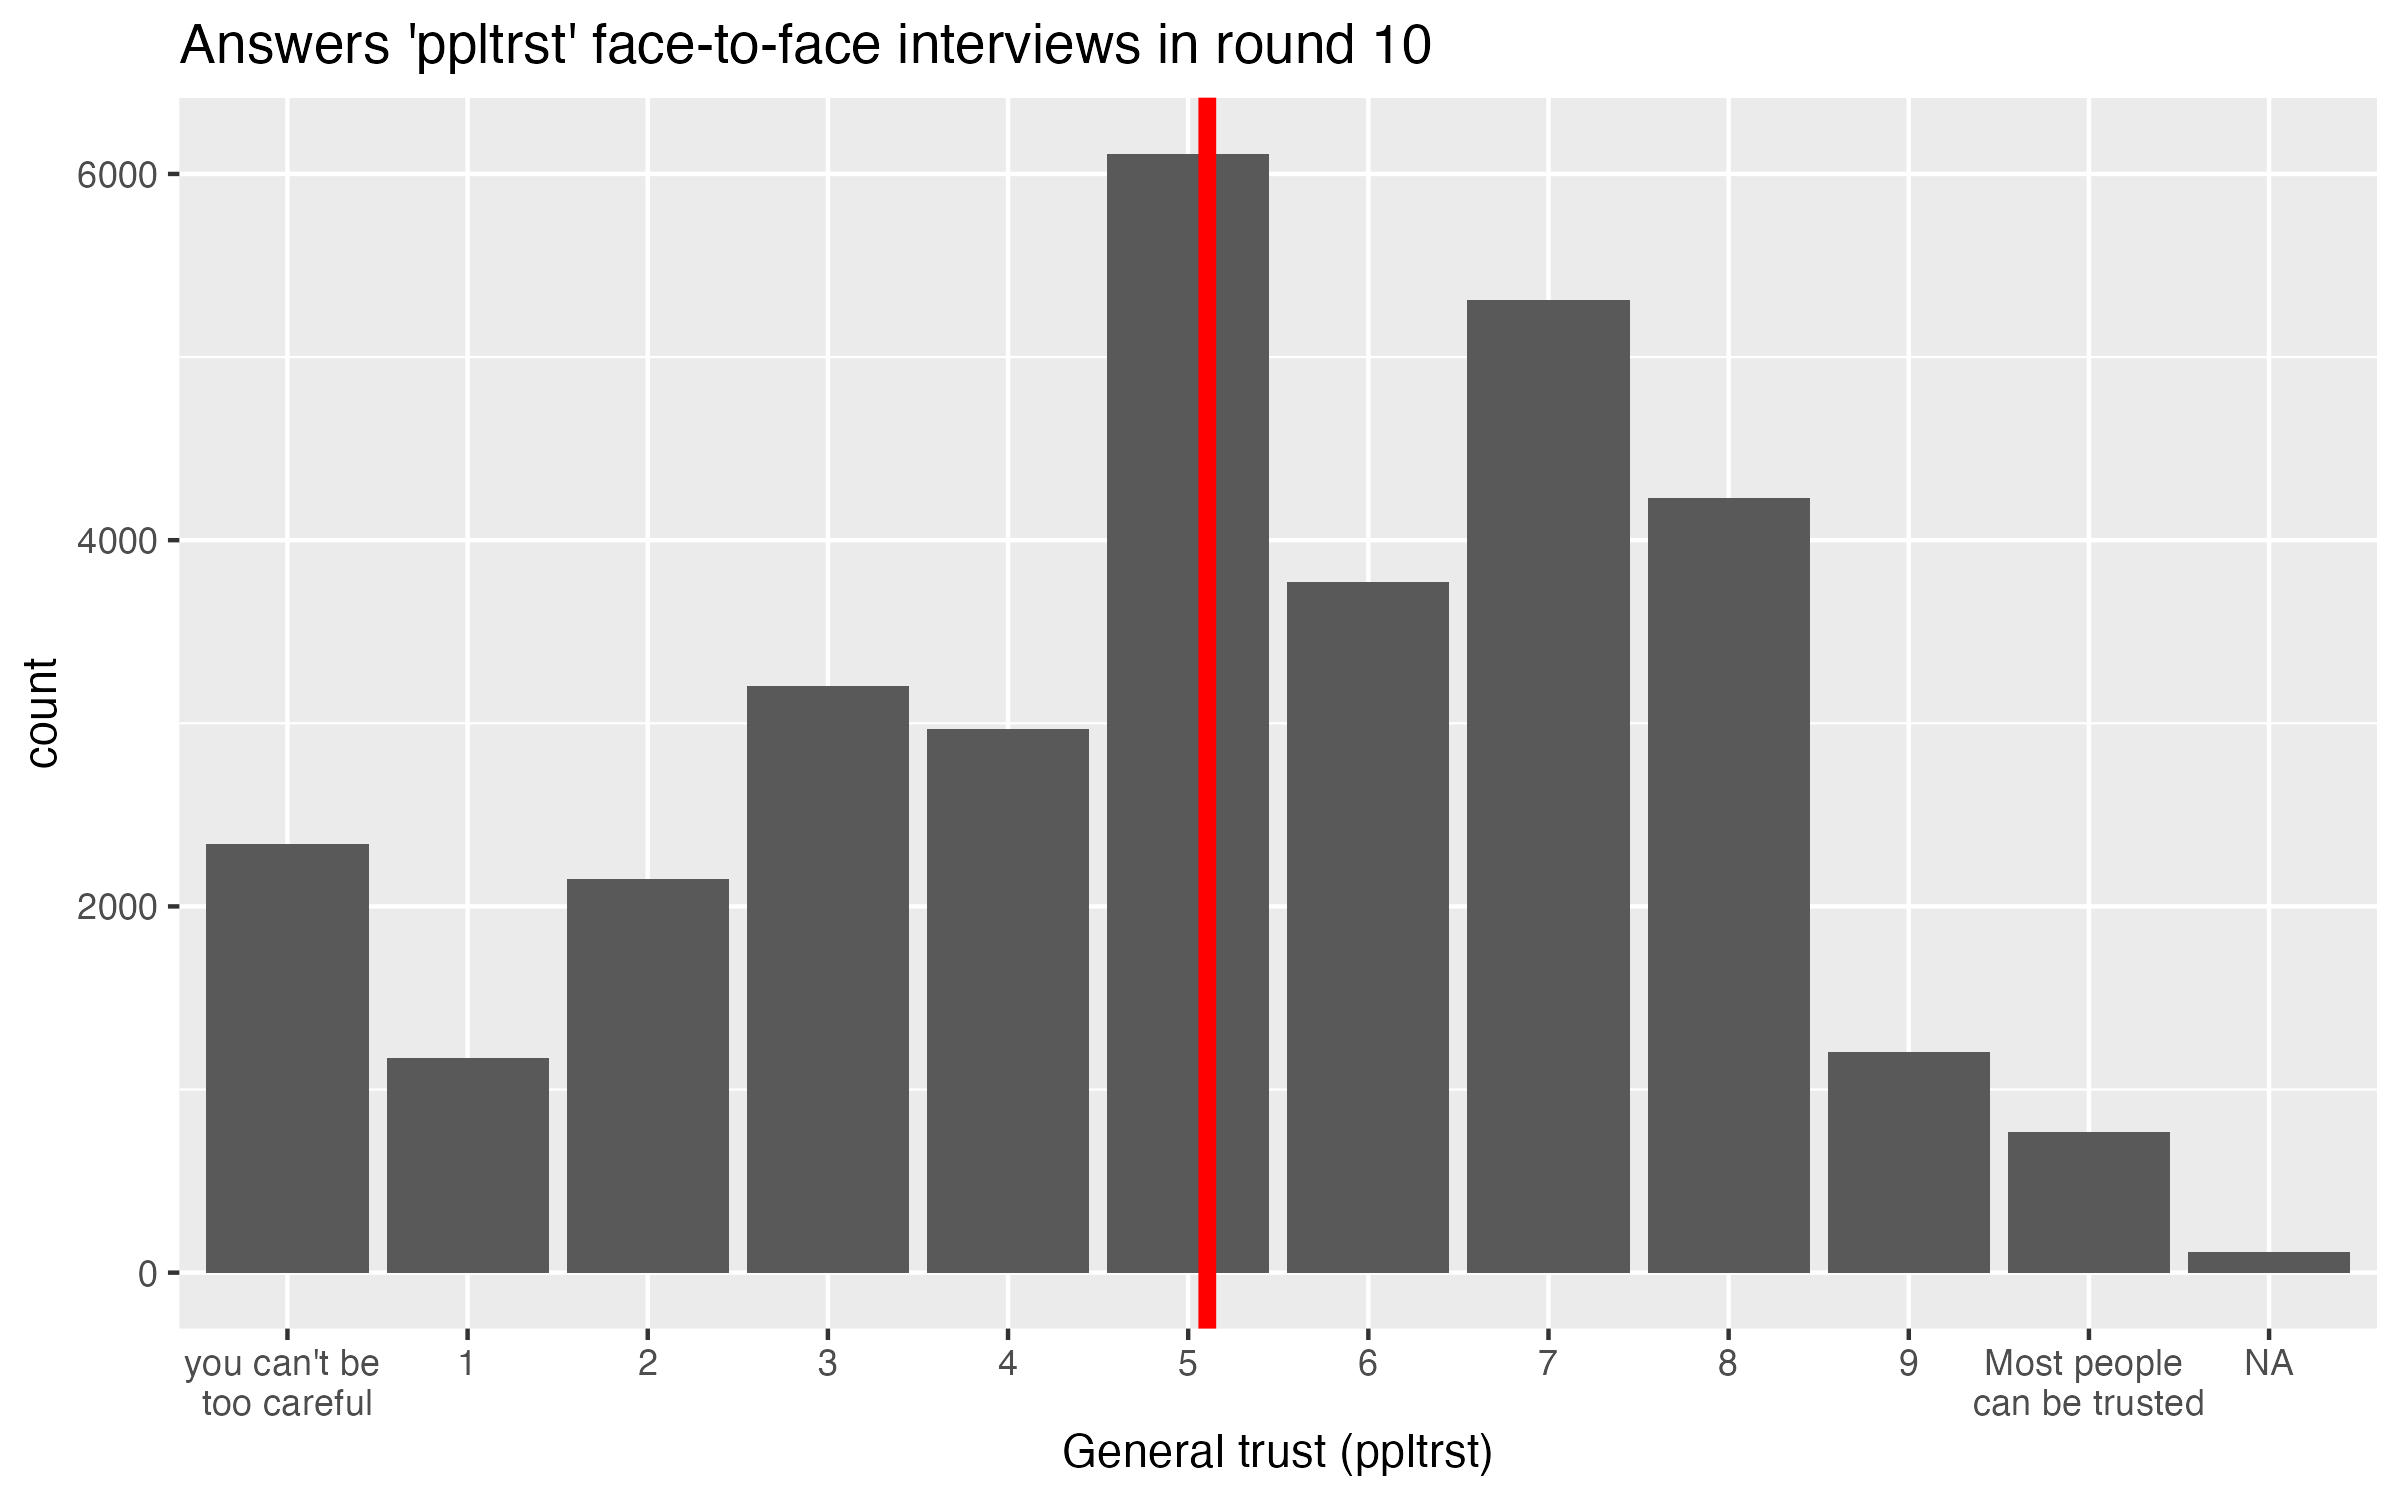
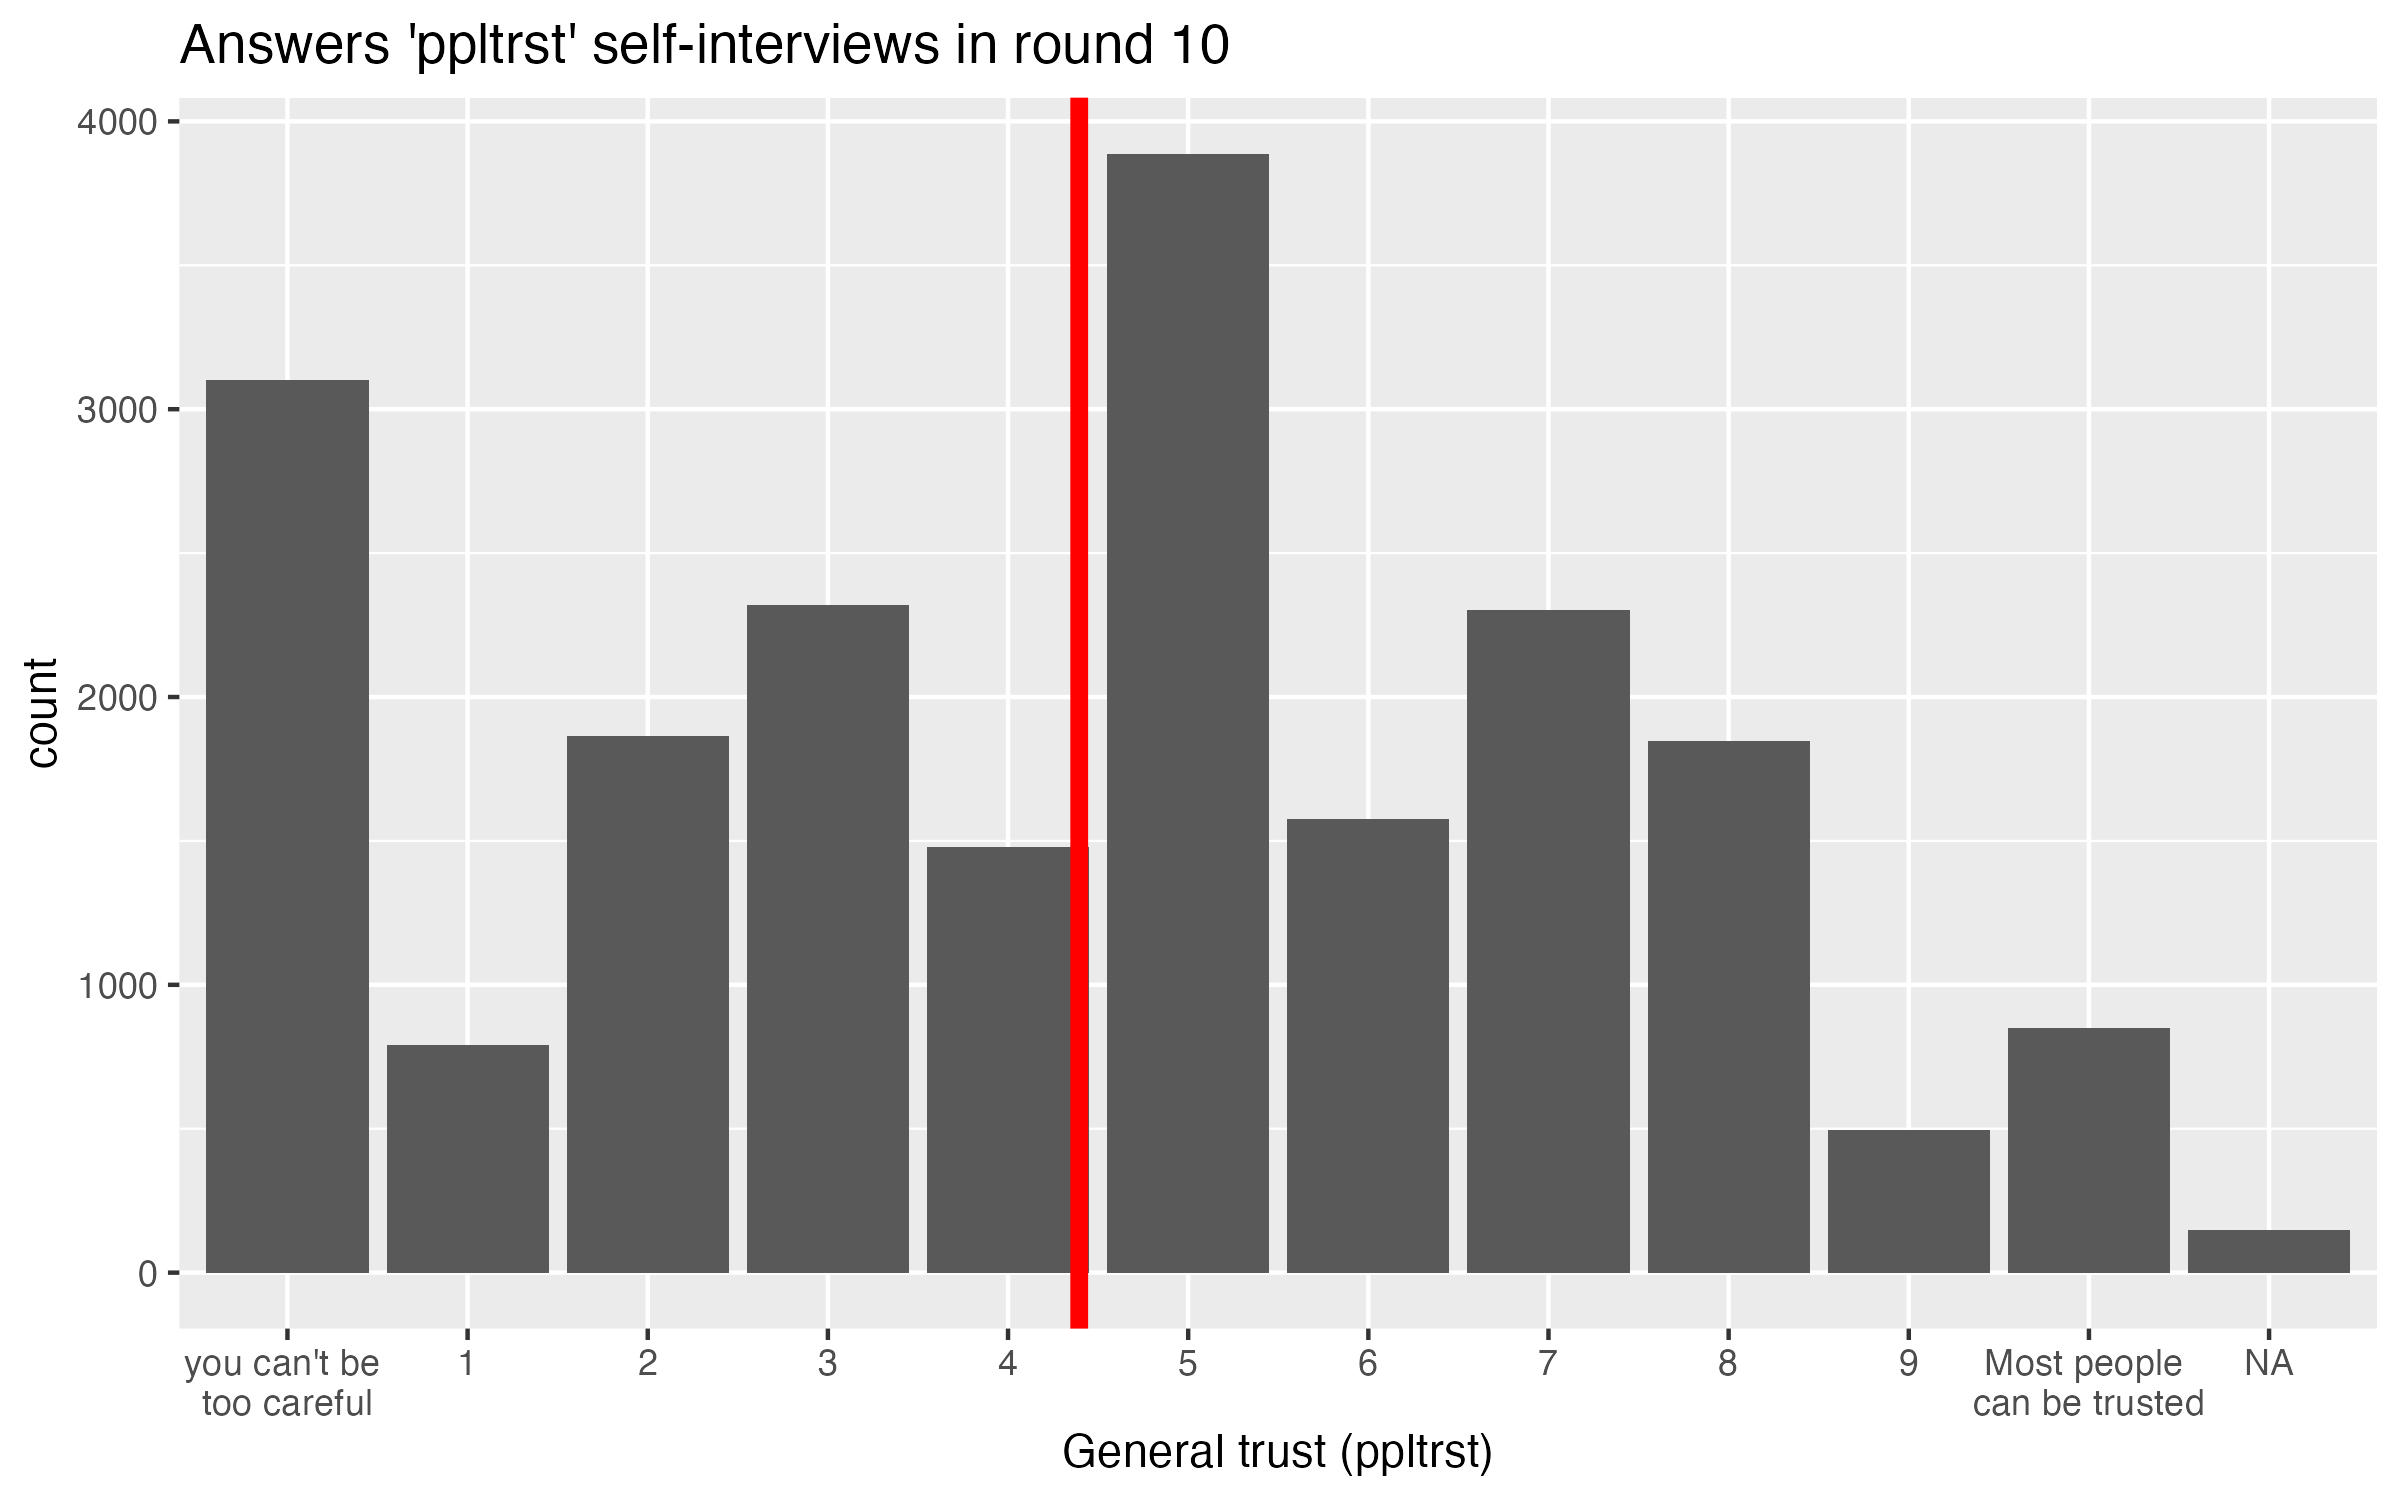
To illustrate the idea of analysing mode effects, see the four figures below.. These show the distribution of responses for the item ‘ppltrst’, which asks:
“Using this card, generally speaking, would you say that most people can be trusted, or that you can’t be too careful in dealing with people? Please tell me on a score of 0 to 10, where 0 means you can’t be too careful and 10 means that most people can be trusted.”
The first two figures show the responses in round 9. 22 countries used face-to-face interviewing in both rounds 9 and 10 (top figure), while 9 countries switched to self-interviewing in round (bottom figure). Here, we do not see differences between the distributions. This makes sense, as in round 9 all interviews were conducted face-to-face.


The more interesting results are to be found when we compare the two groups of responses in round 9. Here, 22 countries stay in face-to-face (top figure below), and if we compare this distribution to the distribution from round 9, we see very little change overall. The second figure below shows what happens when countries switch to self-interviewing: we see a lot more extremely negative responses ‘0 on the scale’, and as a result the mean level of trust is about .50 points lower as compared to round 10.


Is this is a finding that we find consistently across variables? No. In the report, I do analyses for 111 variables in the ESS that are numeric and asked in both round 9 and 10. Over all these variables, I find that shifts in the mean are mostly small. Table 1 below shows the absolute effect sizes of changes in means across all the variables for the two groups of countries. In row 1 countries that used face-to-face in both rounds 9 and 10. In row 2, the countries switching to self-interviewing.
Table 1: Distribution of Hedges g for change in means between round 9 and 10 across 111 ESS variables
| | Min. | 1st quartile | Median | Mean | 3rd quartile | Maximum |
|:——–|:——–|:——–|:——–|:——– |:——– |:——–|
|Absolute Hedges g face-to-face both rounds |0.00| 0.01| 0.03| 0.04| 0.06| 0.13|
|Absolute Hedges g switch to self-interviewing |0.00| 0.04| 0.09| 0.11| 0.17| 0.44|
We see that overall, the changes in means are larger when countries switch to self-interviewing. But not much larger: the absolute median change is only slightly bigger (.04 vs .03), and the difference we see for means is caused by a small number of variables showing quite large changes.
Remember that there can be different reasons for this shift: it could be that we get different kinds of respondents in self-interviewing as compared to face-to-face interviewing. Or, there could be a measurement effect, where respondents answer the same question differently depending on the mode. More on this in another post. I will also write more on what particular variables are susceptible to large changes over time another time. If you can’t wait for this, you can read the full report here